Dr Vincent Gray- NZ Climate Truth newsletter no 260
NEW ZEALAND TEMPERATURES
My Newsletter No 201X of February 2009, revised March 2010 (available on application) showed that published New Zealand records from 1868, 1920 and 1960 show that average temperatures in the main New Zealand cities since records began have not changed significantly from the figures published today
This is confirmed if the so-called "raw figures" for seven selected New Zealand weather stations, available from http://cliflo.niwa.co.niwa are plotted as "anomalies" compared with the 1971-2000 average as follows
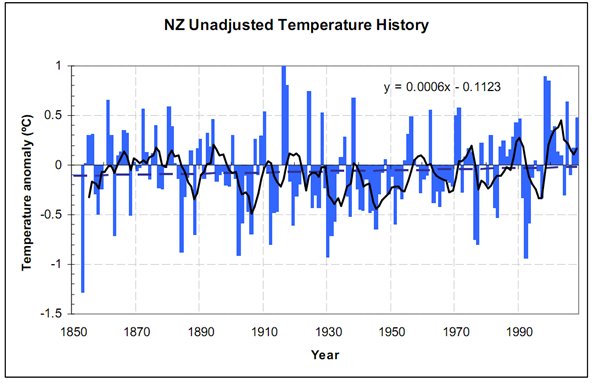
Yet, it is persistently claimed by The National Institrute of Water and Air Research (NIWA) that New Zealand temperatures are rising. This is the result, they claim. from "corrections" that have been made to early figures after changes of site.
Attempts to find details of these "corrections" made by the New Zealand Climate Science Coalition and by the ACT Party in the New Zealand Parliament have been unsuccessful until NIWA commissioned a detailed study of the problem by the Bureau of Meteorology, Australia, Theirr 169 page Report is now available on
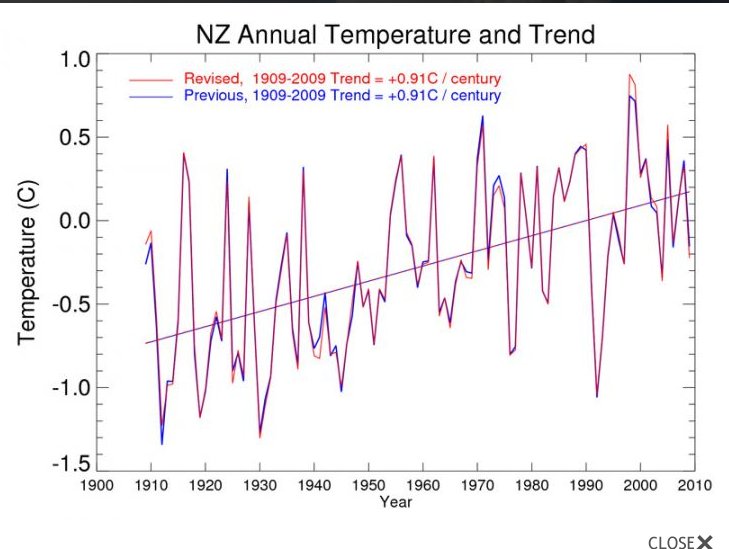
Although the Report comes up with a chart (above) which finds an identical "trend" (0.91ºC per century) to the previous NIWA chart, several other things were changed
* All figures before 1909 in the previous chart have been removed as all seven stations did not provide measurements over this period. NIWA have now removed them from their previous chart.
* The new Report provides a natural explanation for the "trend". One of their "key Points" is as follows
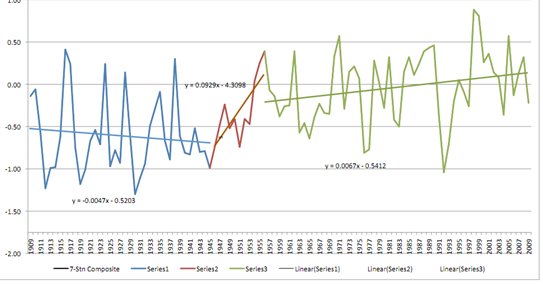
" 3. The variations in time of New Zealand temperature are consistent with completely independent measurements of regional sea temperatures. There is also a strong correlation between variations in New Zealand temperature and prevailing wind flow, which relates closely to the abrupt warming in the mid 20th century, and the slower rate of warming since about 1960"
This means that instead of a single stright line the chart should be divided into the indicated three parts, as follows
* The Report applies "corrections" for site changes based on comparison with "neighbour" stations These are often inbelievable. Auckland is considered to be a "neighbour" of Dunedin and there are many more examples.
*The authors of the Report are uncomfortable with this procedure and with the limited data they received. They said
"The data and methodology provided in the reports from NIWA are taken as an accurate representation of the actual analyses undertaken. We are not in a position to question all of the underlying analyses and data that have contributed to the final results, such as methods used
to compile raw data taken at stations. We do, however, perform some independent analyses as appropriate to the aims of the review as outlined above.
The review does not constitute a reanalysis of the New Zealand ‘seven station’ temperature record. Such a reanalysis would be required to independently determine the sensitivity of, for example, New Zealand temperature trends to the choice of the underlying network, or the
analysis methodology. Such a task would require full access to the raw and modified temperature data and metadata, and would be a major scientific undertaking. As such, the review will constrain itself to comment on the appropriateness of the methods used to undertake the ‘seven station’ temperature analysis, in accordance with the level of the information supplied".
* No attempt is made to "correct" for other sources of error such as urban heating, or the change to automatic measurement.
*The most obvious defect5 of all the cahrts is that the points on them are treated as if they were constants, whereas they are all subject to a large number of errors These include "measurement error" in the original daily readings, the use of a Maximum/Minimum average instead of a true average, the averaging procedure over the week, the month and the year the subtraction from the "baseline figure" the replacement of missing readings, the changes in instruments. The combined errors would require "95% error bars" to be atteched above and below each point of each chart. These could easily be of the order of several degrees Celsius. and means that a"trend" per century of less than one degree has very low statistical significance.
One can only conclude that average temperatures in New Zealand cities have not changed significantly since records began.
Cheers
Vincent Gray