Did you know - Professor Emeritus Geoff Duffy DEng, PhD, BSc, ASTC Dip, FRS NZ, FIChemE, CEng
CLIMATE-CHANGE FACTS Experimental data speak louder than theoretical predictions !! (As at November 2009)
DID YOU KNOW … that there was 500,000 square kilometres MORE ARCTIC sea ice cover in October 2009 than at the same month in 2008 (total ice cover is close to the November 2005 amount)
DID YOU KNOW … that each year more than 8,000,000 square kilometres of ice melts and reforms each year!! This area is about the same area size of Australia or the continental USA melting and reforming each year. That is a massive amount!!
DID YOU KNOW … that the ARTIC ice coverage goes from about 5,500,000 square kilometres to about 14,000, 000 square kilometres EACH year. NOW in November 2009 it is in the middle of ALL recorded data since 2002 (see red curve and red arrow). So there is no need for alarm! [Ice cover was 10,326,064 square kilometres on 27th November 2009].

DID YOU KNOW … that the CHANGE in the Global lower TROPOSPHERE temperature has actually dropped since 2005 to about the normal year-average level of changes [See University of Alabama, Huntsville, USA. NASA Satellite Data]. [Troposphere: The atmosphere about 20km high at the tropics, 7km at the poles; 75% of the earth’s atmosphere; the boundary with the Stratosphere above it is where the air ceases to cool with increasing height (temperature inversion point), and where it is dry]

DID YOU KNOW … that the average temperature in the USA dropped in 2008-2009 to the normal-year average levels [See USA National Climate Data Center graphs following].

USA 1895-2009 average temperature [National Climate Data Center]

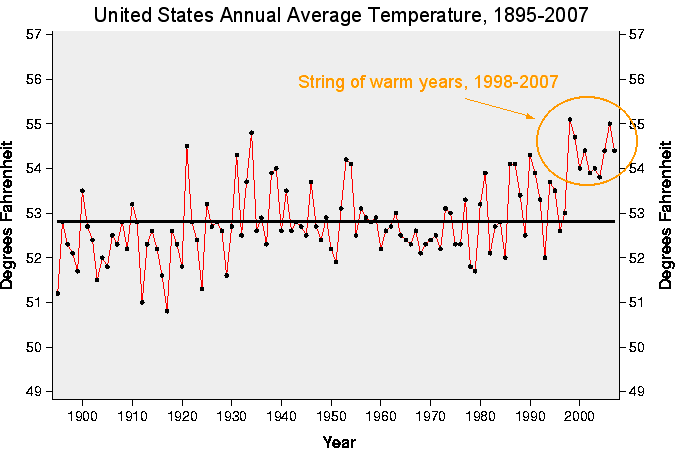
USA 1895-1997 Average temperature (a) up to 1997, then (b) up to 2007. The 1998 El Niño increased USA and global temperatures for a decade before the drop in 2008, 2009 (first graph) (warm period anomaly) [National Climate Data Center].
SEPARATE TEMPERATURE AND PRECIPITATION DATA >>>

PRECIPITATION

Overall temperature and average precipitation data 1895-2009
DID YOU KNOW … that the average Antarctic temperatures have remained the same over the last 40 years 1950-2005, with mostly normal seasonal changes. Only the Antarctic Peninsula (part pointing toward South America) temperatures have changed, but these data have been misapplied to mean the whole Antarctic has been warming.

A 30-year MINIMUM Antarctic snowmelt Summer 2008-09 (Based on spaceborne microwave data 1980-2009), caused mainly by the El-Nino oscillation

Standardized values of the Antarctic snow melt index (October-January) from 1980-2009 (adapted from Tedesco and Monaghan, 2009).
DID YOU KNOW … that the sunspot activity has dropped to virtually zero over the last several months resulting in a lowering of the magnetic field and thus the lowering of the ‘surface’ temperature on earth [actually the deepest solar minimum for nearly a century].
A lower number of sunspots mean a lower trend in global temperatures. [Sunspots are strong magnetic fields that appear dark on the sun’s surface because they block the upflow of heat from the sun’s interior (sunspots are up to 50,000km in diameter)].
Infrared Zeeman splitting technique, Livingston and Penn 1992 -2009 [National Solar Observatory, Tuscon, Arizona]


DID YOU KNOW … that the SEA surface temperature as measured by NASA satellite is now on the decline (since July 2009).


NASA Data 3rd September 2009
DID YOU KNOW … that most of the Antarctic ICE is expanding, not melting. This is contrary to widespread public belief (verified by ice-core drilling and sea ice monitoring). The Scientific Committee on Antarctic Research of Antarctic Treaty nations reported recently in Washington that, ‘cooling at the South Pole was significant in recent decades’. The eastern part of Antarctica is four times the size of west Antarctica, and ice losses in west Antarctica over the past 30 years have been more than offset by increases in the eastern part of the Ross Sea region. Ice core drilling in the fast ice off Australia’s Davis Station in East Antarctica by the Antarctic Climate and Ecosystems Co-Operative Research Centre shows that last year, the ice had a maximum thickness of 1.89m, its densest in 10 years. The average thickness of the ice at Davis since the 1950s is 1.67m.
It is reported that ANTARCTIC sea ice has increased 4.7% since 1980. Over 90% of the World’s glaciers are in the Antarctic and they are growing.


NASA: A composite map of Antarctica showing areas of greatest warming in red. The Wilkins Ice Shelf lies off the peninsula in the top left corner.
DID YOU KNOW … that the Antarctic is approximately 14,000,000 square kilometres and about 7-8,000,000 square kilometres of shelf ice melts and reforms each year (about the same area size of Australia).
[ 90% of the World’s ice and 70% of the World’s fresh water are at the Antarctica. The average elevation of Antarctica is about 2,500m with the highest point over 4km above sea level. It is the coldest, driest, windiest, and highest place on earth].
[Sea ice around Antarctica varies from about 8 million square miles in September or October to about 1 million square miles in January or February. NASA image of sea ice maximum image from the Nimbus 7 Scanning Multichannel Multiwave Radiometer(1978 to 1987)].
Picture NASA

DID YOU KNOW … that India’s 10,000 or so Himalayan glaciers are NOT all receding. Vijay Kumar Raina (formerly of the Geological Survey of India) reports that the 30km long Gangotri glacier (source of the Ganges) retreated at about 22 m/year from 1934 to 2003 and shed 5% of its length; then decreased to about 12m/year in 2004-05, and is NOW practically at a standstill. The glacier melt contributes only 3-4% of the Gange’s annual flow, with most coming from monsoon rains, which have not always been regular.
The Siachin glacier in Kashmir has not shown any remarkable retreat in 50 years ( K Kumar, G B Pant Institute of Himalayan Environment and Development, Almora).
In Greenland, Tavi Murray (Swansea University) reported that two of the major glaciers, Helheim and Kangerdlugssuag, had slowed significantly by 2006, and reported that in 2007-08 that there has been a ‘synchronous switch-off’ of speed-up of the 14 largest outlet glaciers in southeast Greenland … not a ‘runaway acceleration’ that has erroneously been reported.
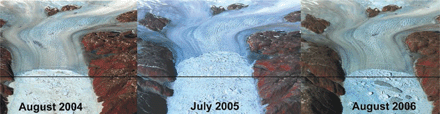
Helheim Glacier's flow to the sea sped up in 2005, as evidenced by the 5-kilometer retreat of its leading edge, but by 2006 it had slowed back down. Credit: Ian Howat.
DID YOU KNOW … that the BALANCE of airborne and the absorbed-fraction of CO2 has stayed approximately constant since 1850 (even though CO2 emissions have risen from 2 billion tons/year to 35 billion tons/year). This shows the ecosystem and oceans have a much greater capacity to absorb CO2 than previously thought. Dr W Knorr (University of Bristol) determined the change in the airborne fraction since 1850 has been 0.7+/- 1.4% per decade … practically zero!
Annual increase in atmospheric CO2 has remained CONSTANT PROPORTIONED to the amount of man-made CO2 released

DID YOU KNOW … that the SEA LEVEL has risen only 1.6mm/yr over the last 100 years. That equates to only 160mm per century (0.16m or 6.3inches in old terms over 100 years!). There has been no change in the rate even from 1990. Data have been obtained independently worldwide and also officially in New Zealand in independent studies in several cities.
Compiled by: Professor Emeritus Geoff Duffy
DEng, PhD, BSc, ASTC Dip, FRS NZ, FIChemE, CEng